 Cui
Agents are good at producing static charts. Letting the reader click, brush, zoom and cross-highlight is where they struggle: the blog says agents rarely get an interactive chart right in one turn, and repeated rounds of reasoning, coding and debugging burn tokens, while expressive charts easily break layout or interaction. Microsoft Research’s Flint-interactive (docs) is a language that tries to close that gap. This is a summary of the blog; I have not run it.
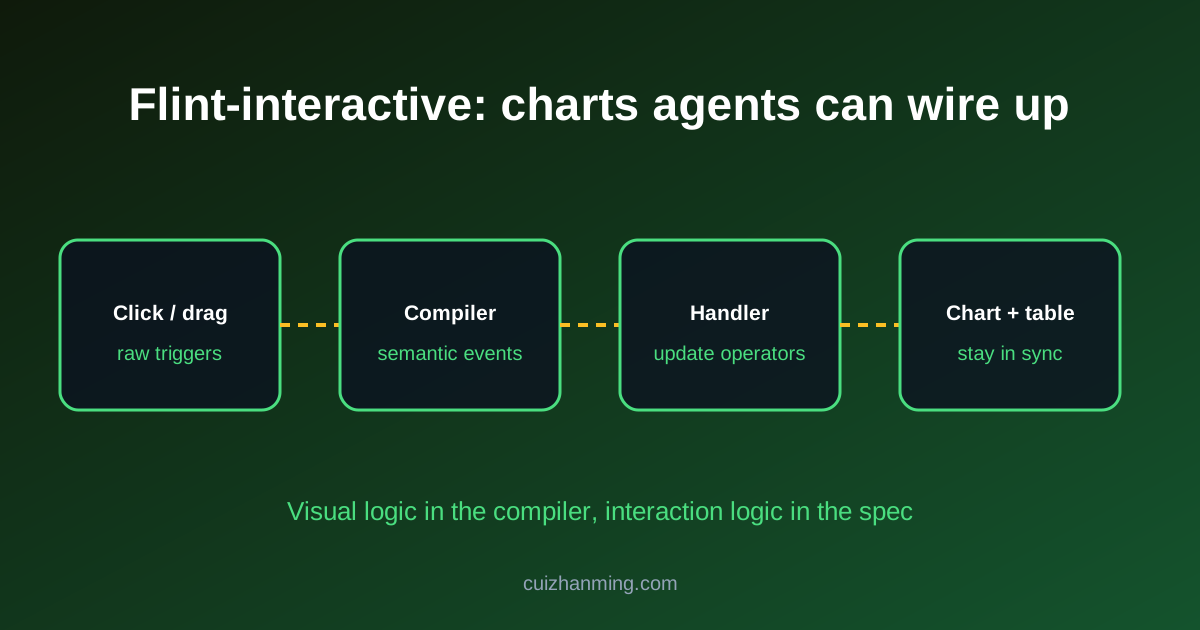
The core idea: split visual logic from interaction logic
- Visual logic (compiler). Resolves raw triggers such as clicks, drags and key presses into semantic events that identify chart elements and data. It also translates update operators into rendered changes, including hit testing.
- Interaction logic (you or the agent). Maps semantic events to update operators, for example set style to highlight data, set annotation to label a point, or set viewport to pan and zoom. The same events can drive external tables, widgets and application state.
Flint Canvas is a state machine tracking interactions and rendering state. The agent never touches renderer-specific marks, which is where most generated interactive code breaks.
Three ways to use it
-
In chat. Via Flint-MCP and MCP Apps, following the MCP setup guide. The agent generates an
interaction_specnext to the Flint chart spec and the chart renders in the conversation. Selections can be passed as context to follow-up turns. - In an app. Embed Flint Interactive Canvas in a dashboard or data story. Handle semantic events to filter a table or update another chart, and send update operators from your own widgets.
- Bespoke interactions. Define a trigger and a custom handler through the programming API. The blog’s example highlights a clicked country and labels it by combining set-style and set-annotation, and a DimpVis-style drag along a time path.
Presets such as linked-brush cover common cases, and the blog invites proposals for new presets on GitHub. It also suggests sharing an interaction-author skill with your coding agent.
What I take from it
- A small declarative layer is an agent-friendly interface. The model emits a short spec, and a compiler owns the fiddly parts. That is the same trade as structured tool schemas over free-form code.
- Selection as context is the interesting part for agent UX. Clicking a point and asking a follow-up about it turns the chart into an input device for the conversation.
- It rides on MCP Apps. If you already expose tools through MCP, this is a concrete example of UI returned by a tool, not just text.
- Open question. The blog claims better reliability and lower cost but gives no numbers in the post, so test on your own data before relying on it.
Source: Microsoft Research blog.
 How Microsoft Evaluates Copilot Without Touching Customer Data

Click to load Disqus comments